March 30, 2018
Weather report
Update 23 Sept. 2019 There’s a better version of this script available, see here.
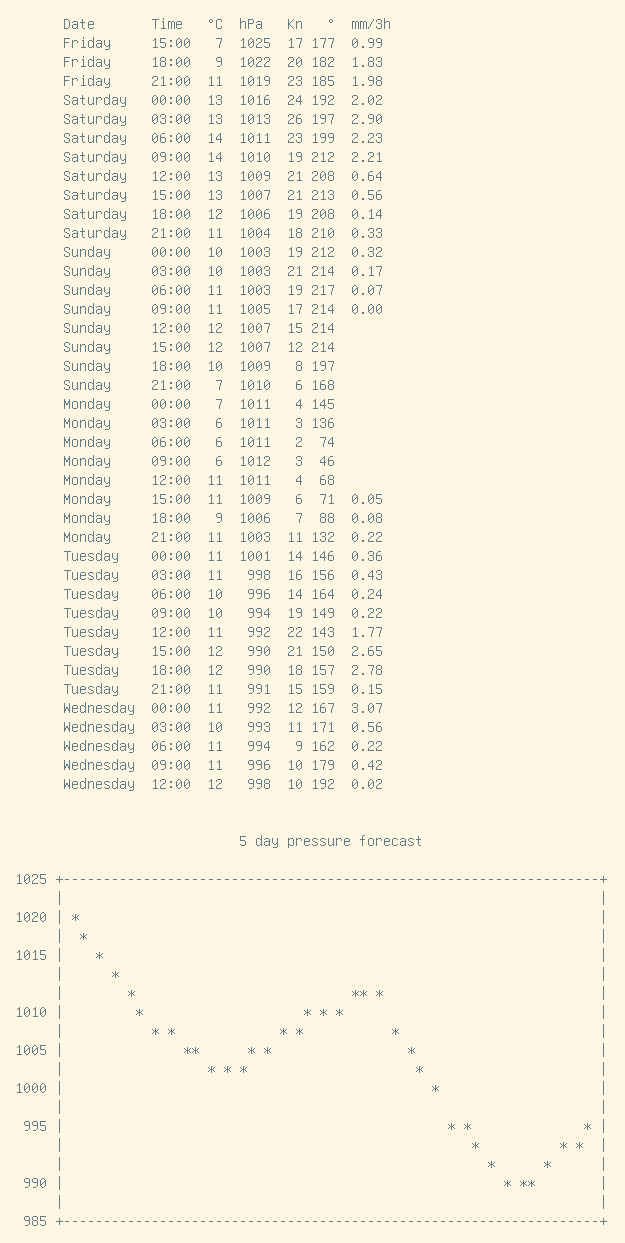
Using OpenWeatherMap’s API it is possible to get JSON-encoded forecasts for my local area. I use jq and gnuplot to format the forecast into something that looks good in my terminal:
      Date       Time   °C  hPa   Kn   °  mm/3h
      Friday     15:00   7  1025  17 177  0.99
      Friday     18:00   9  1022  20 182  1.83
      Friday     21:00  11  1019  23 185  1.98
      Saturday   00:00  13  1016  24 192  2.02
      Saturday   03:00  13  1013  26 197  2.90
      Saturday   06:00  14  1011  23 199  2.23
      Saturday   09:00  14  1010  19 212  2.21
      Saturday   12:00  13  1009  21 208  0.64
      Saturday   15:00  13  1007  21 213  0.56
      Saturday   18:00  12  1006  19 208  0.14
      Saturday   21:00  11  1004  18 210  0.33
      Sunday     00:00  10  1003  19 212  0.32
      Sunday     03:00  10  1003  21 214  0.17
      Sunday     06:00  11  1003  19 217  0.07
      Sunday     09:00  11  1005  17 214  0.00
      Sunday     12:00  12  1007  15 214
      Sunday     15:00  12  1007  12 214
      Sunday     18:00  10  1009   8 197
      Sunday     21:00   7  1010   6 168
      Monday     00:00   7  1011   4 145
      Monday     03:00   6  1011   3 136
      Monday     06:00   6  1011   2  74
      Monday     09:00   6  1012   3  46
      Monday     12:00  11  1011   4  68
      Monday     15:00  11  1009   6  71  0.05
      Monday     18:00   9  1006   7  88  0.08
      Monday     21:00  11  1003  11 132  0.22
      Tuesday    00:00  11  1001  14 146  0.36
      Tuesday    03:00  11   998  16 156  0.43
      Tuesday    06:00  10   996  14 164  0.24
      Tuesday    09:00  10   994  19 149  0.22
      Tuesday    12:00  11   992  22 143  1.77
      Tuesday    15:00  12   990  21 150  2.65
      Tuesday    18:00  12   990  18 157  2.78
      Tuesday    21:00  11   991  15 159  0.15
      Wednesday  00:00  11   992  12 167  3.07
      Wednesday  03:00  10   993  11 171  0.56
      Wednesday  06:00  11   994   9 162  0.22
      Wednesday  09:00  11   996  10 179  0.42
      Wednesday  12:00  12   998  10 192  0.02


                            5 day pressure forecast

1025 +-------------------------------------------------------------------+
     |                                                                   |
1020 | *                                                                 |
     |  *                                                                |
1015 |    *                                                              |
     |      *                                                            |
     |        *                           ** *                           |
1010 |         *                    * * *                                |
     |           * *             * *           *                         |
1005 |               **      * *                 *                       |
     |                  * * *                     *                      |
1000 |                                              *                    |
     |                                                                   |
 995 |                                                * *              * |
     |                                                   *          * *  |
     |                                                     *      *      |
 990 |                                                       * **        |
     |                                                                   |
 985 +-------------------------------------------------------------------+
Here’s the script that pulls it all together:
#!/bin/sh

set -e

# Fill in location and api_key here
location=''
api_key=''
units=metric

[ ! -d "$HOME"/dl ] && mkdir "$HOME"/dl

fcast=$HOME/dl/forecast

get_weather() {
    curl -sfL -G 'http://api.openweathermap.org/data/2.5/forecast' \
        --data id="${location}" \
        --data units="${units}" \
        --data appid="${api_key}" \
        -o "${fcast}"

    jq -r '.list[] | .main.pressure' "${fcast}" |
        sed 's/\.[0-9]\+$//' >"$HOME"/dl/pressure
}

[ ! -f "${fcast}" ] && get_weather

time_now=$(date +%s)

case $(uname) in
Darwin | *BSD) mtime=$(stat -f "%m" "${fcast}") ;;
Linux) mtime=$(stat -c "%Y" "${fcast}") ;;
esac

[ $((time_now - mtime)) -gt 3600 ] && get_weather

printf '\n\t%-11s%4s%6s%5s%5s%5s%7s\n' \
    "Date" "Time" "°C" "hPa" "Kn" "°" "mm/3h"

jq -r ".list[] | .dt_txt, .main.temp, .main.pressure, \
    .wind.speed, .wind.deg, .rain.\"3h\"" "${fcast}" |
    paste - - - - - - |
    while read -r fdate ftime temp pressure wspeed wdeg rain; do

        printf '\t%-11s' "$(date -j -f '%F' +%A "${fdate}")"
        printf '%5s' "${ftime%:*}"
        printf '%4.0f' "${temp}"
        printf '%6.0f' "${pressure}"
        if [ "${wspeed}" = 0 ]; then
            printf '%d' "0"
        else
            printf '%4.0f' "$(units "${wspeed} m/s" knots |
                awk 'NR < 2 { print $2 }')"
        fi
        printf '%4.0f' "${wdeg}"
        if [ "${rain}" != null ]; then
            printf '%6.2f' "${rain}"
        fi
        printf '\n'

    done

gnuplot <<EOF
    set terminal dumb
    set ytics add ('' 0) scale 0
    unset xtics
    set title "5 day pressure forecast"
    plot "$HOME/dl/pressure" t "" pt "*"
EOF
The script is set up for metric data, so you’ll have to edit it if you’re using the imperial system. And you’ll need an API key (available free), along with a location code.