September 23, 2019
A better weather report
I previously posted a shell script to fetch weather information from OpenWeatherMap’s API and format it. While testing it in different shells, I found that it was quite slow in my shell of choice, the portable version of OpenBSD’s ksh. This is because oksh (and mksh, and pdksh from which they are descended) does not have a builtin printf. Anyway, while looking into how to get around that – using awk – I reworked a lot of stuff, and now have a faster script that (I think) is clearer to scan. Here’s what the current output looks like:
                  °C   hPa  ms  dir mm/3h
Monday     21:00  14   995   4  S   0.44
Tuesday    00:00  13   995   4  S   0.31
           03:00  14   994   4  S   0.38
           06:00  12   994   4  SE
           09:00  14   993   5  SE
           12:00  14   992   6  SE  1.00
           15:00  14   991   4  SE  0.75
           18:00  14   992   3  NE  0.56
           21:00  14   995   3  N   0.25
Wednesday  00:00  12   997   1  NW  0.06
           03:00  11   999   1  W
           06:00  12   999   3  SW
           09:00  14  1000   4  SW
           12:00  15  1000   4  S
           15:00  16   998   5  SW  0.56
           18:00  15   996   5  SW  0.50
           21:00  15   996   6  SW  9.38
Thursday   00:00  12   996   5  SW  0.56
           03:00  11   996   5  SW  0.31
           06:00  11   996   5  SW  0.56
           09:00  12   997   5  SW  0.44
           12:00  13   998   6  SW  1.12
           15:00  14   997   8  SW  0.81
           18:00  12   997   5  SW  0.81
           21:00  12   997   6  SW  0.75
Friday     00:00  13   996   7  SW  1.06
           03:00  12   996   7  SW  1.19
           06:00  10   998   4  W   0.25
           09:00  12   999   5  W   0.12
           12:00  15  1000   7  W   0.38
           15:00  14  1000   7  W   0.31
           18:00  12  1001   5  SW  0.19
           21:00  12  1002   6  SW
Saturday   00:00  11  1002   5  W   0.38
           03:00  11  1002   5  W
           06:00  12  1002   5  SW
           09:00  13  1003   7  W   0.31
           12:00  15  1005   7  W   0.31
           15:00  15  1004   6  W   0.06
           18:00  11  1004   3  W   0.56

    x: [0 - 39]    y: [991 - 1005] -- 0: *
+
|                                    *
|                                     **
|                               *****
|                              *
+         ****              ***
|             *      *     *
|        *         ** ***
**      *      ****      **
| **
+   ** *
+    .*   .    .    .    .    .    .    .
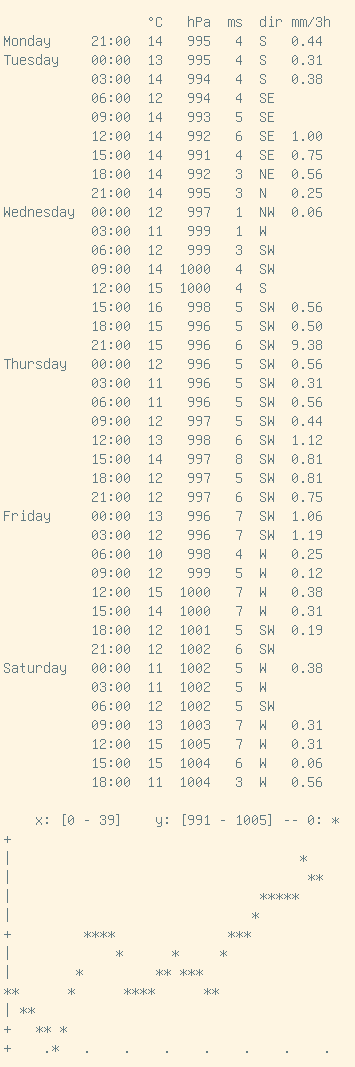
The script now looks for guff to do the forecast trend plot; it’s faster and lighter than gnuplot but if guff isn’t found the script will still use gnuplot if it’s available. (If neither is found the script will just exit silently.)
The whole thing is in a shiny new git repository.